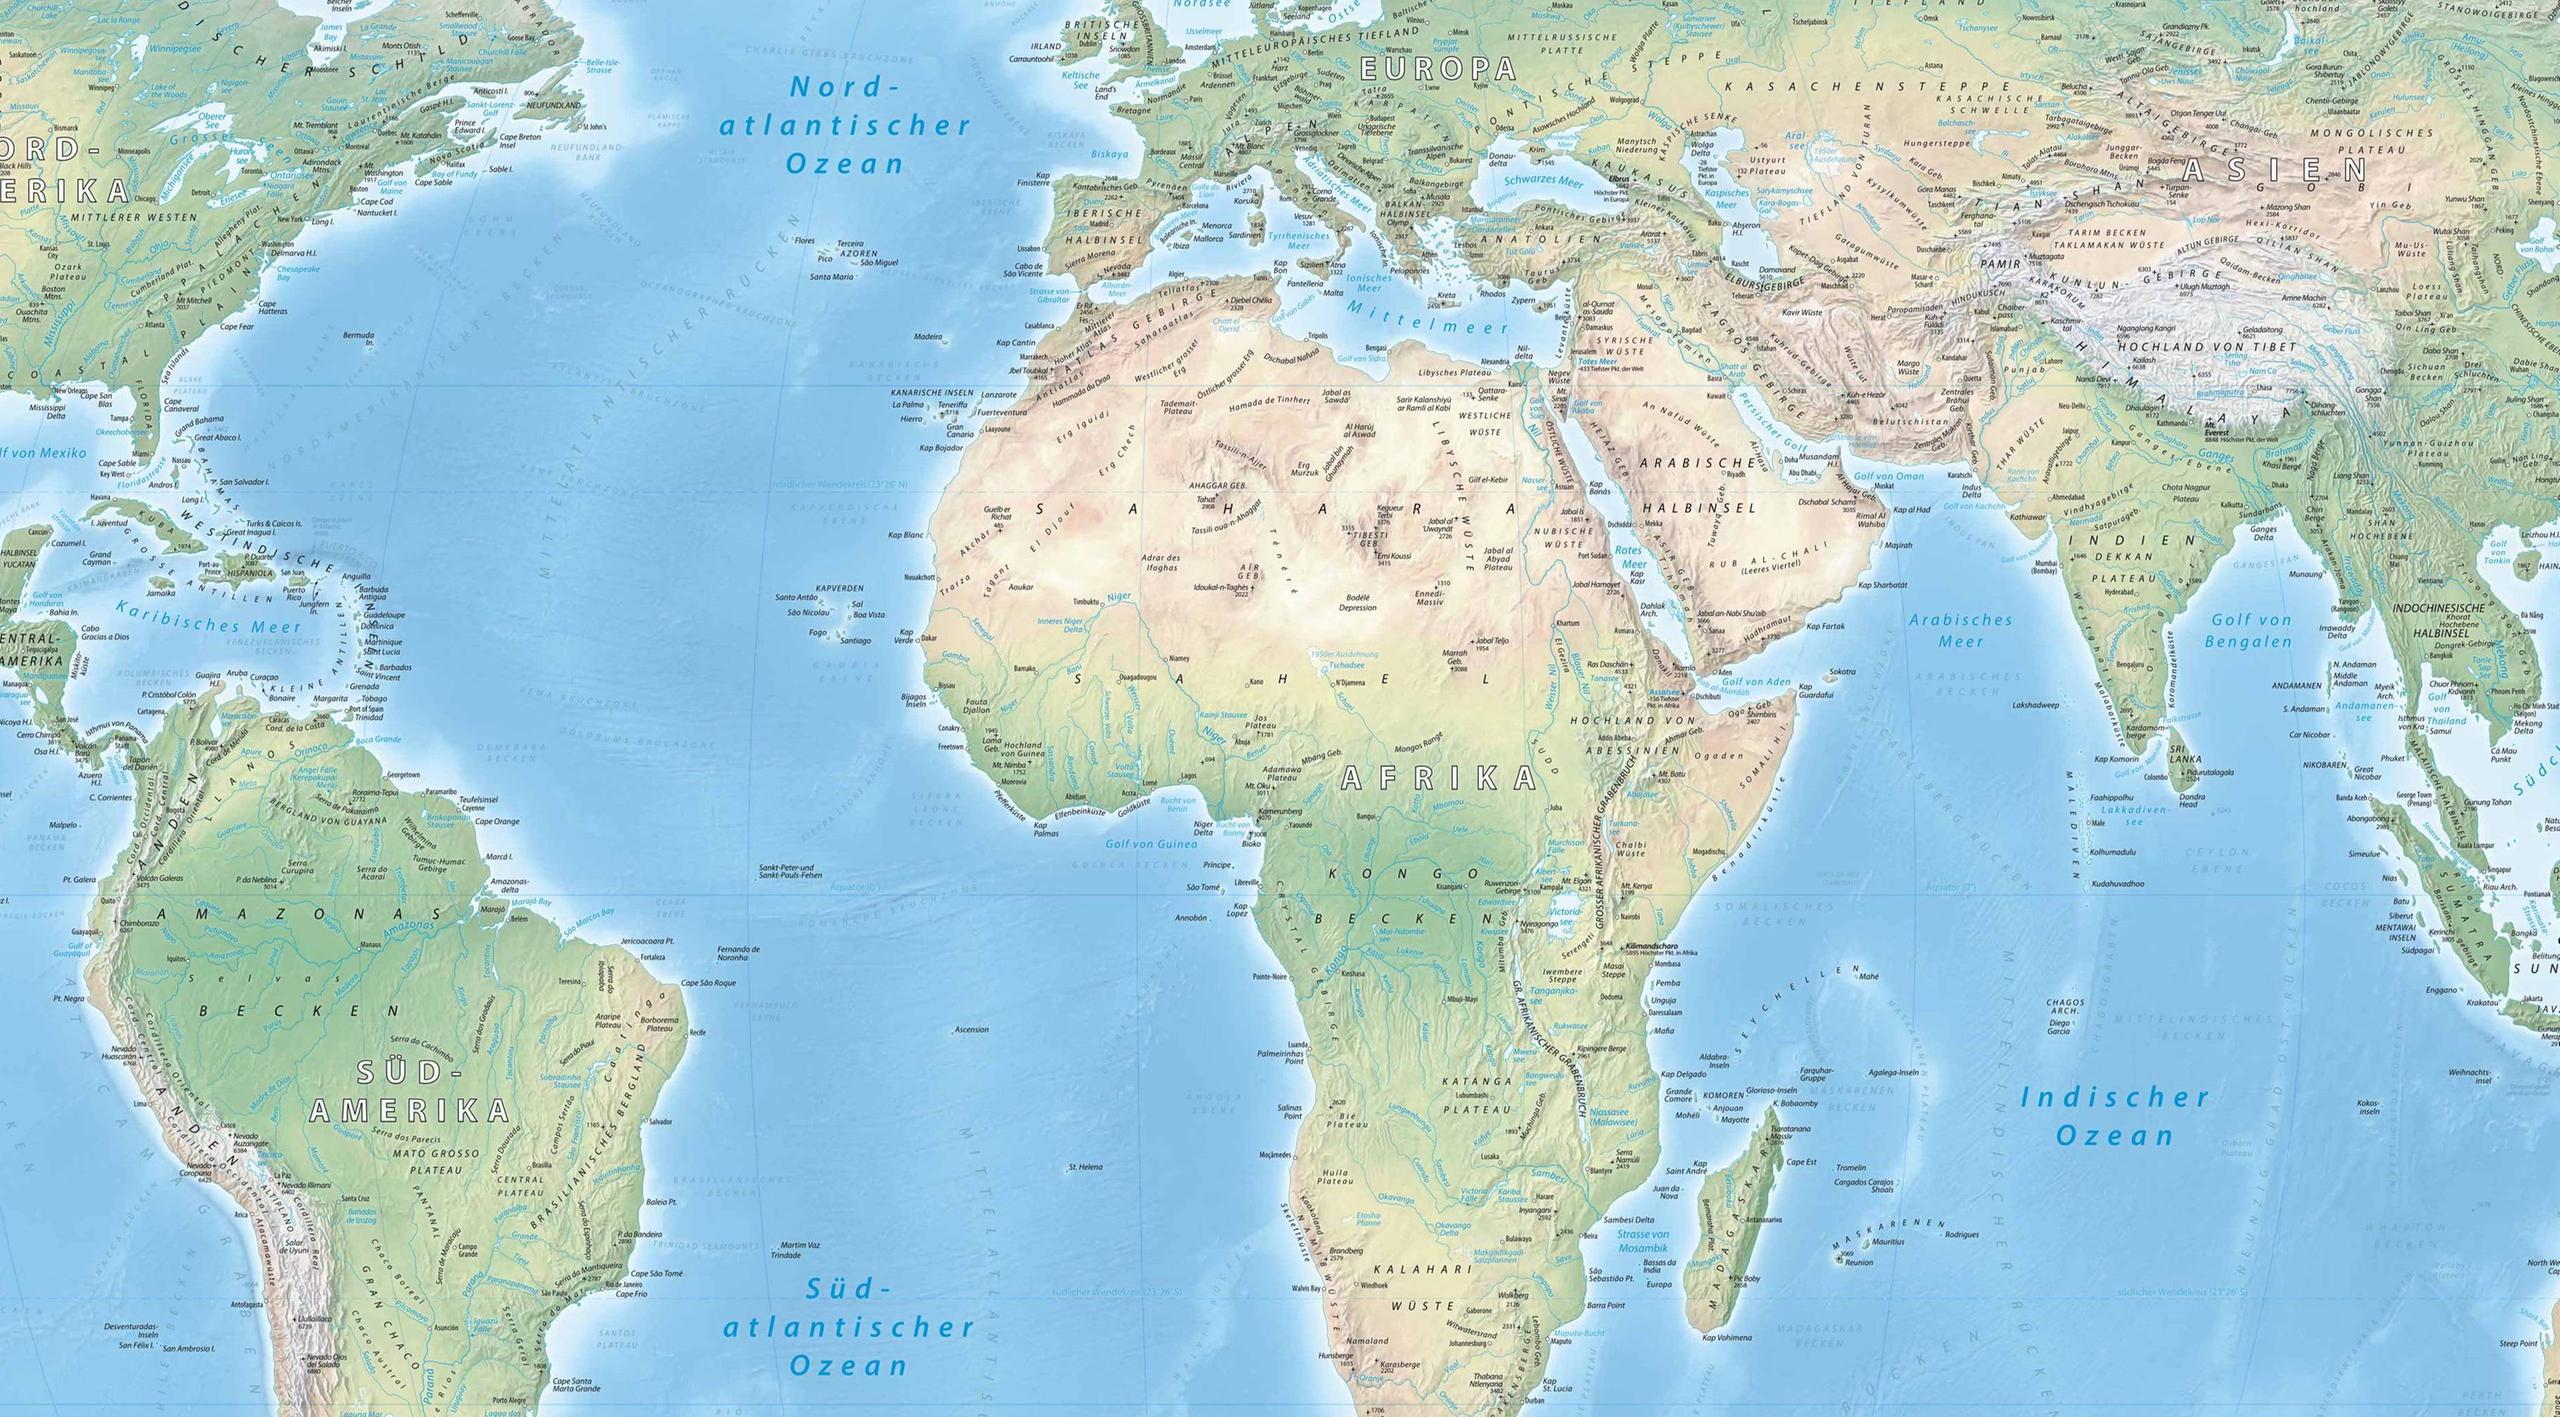
Main navigation
Content
An important partner in international cooperation
India, with its more than 1.3 billion inhabitants, is the largest parliamentary democracy in the world.
In spite of the many challenges that India faces, in political terms the country has managed to remain largely stable since it was founded in 1947. And it has made progress in reducing poverty.
According to the 2019 Global Multidimensional Poverty Index (MPI), the percentage of the population living below the poverty line fell from 55 per cent in 2006 to 28 per cent in 2016.
Although the prosperous middle and upper classes are growing, there are still many millions of people who must get by on the equivalent of 1.90 US dollars a day.
Achieving poverty reduction while at the same time protecting natural resources is the biggest challenge that India's politicians, businesses and society are facing.
Development cooperation
India has a key role to play in finding solutions for global challenges such as how to protect the climate or achieving the global development goals adopted in the 2030 Agenda. That is why India is one of Germany's "global development partners" for international development cooperation.
Priority areas of German-Indian development cooperation are renewable energy and energy efficiency, sustainable urban development, and environmental protection and resource conservation. The main focus of this cooperation is supporting climate change mitigation and adaptation.
Straight to
German development cooperation with India
German-Indian development cooperation is a matter of painstaking dialogue between equal partners. It is characterised by mutual trust and a high degree of success.
German cooperation with global development partners such as India focuses on programmes with a structural impact. These programmes build on India's own efforts and reform programmes. They demonstrate model solutions and leave the participating partners qualified to carry on with, or extend, the projects on their own.
In 2019, Germany committed a record amount of 1.614 billion euros for cooperation with India. Of that total, 1.595 billion euros is for Financial cooperation. The lion's share of this funding is provided as loans at near-market conditions, to be paid back with interest by India.
The following priority areas have been agreed by the two governments for their programme of collaboration:
- Renewable energy and energy efficiency
- Sustainable urban development
- Environmental protection and resource conservation
Other German activities in India include measures being implemented under Germany's special "ONE WORLD – No Hunger" initiative, support for a Green Innovation Centre, measures to protect the soil and boost food and nutrition security, and measures to improve sustainability in the cotton producing sector.
Technical and vocational education and training
Furthermore, Germany is actively supporting India in its efforts to set up a dual system of practice-oriented vocational education and training, in order to help create job opportunities for the younger population and improve the competitiveness of medium-sized businesses. At the German-Indian government consultations in November 2019, two declarations of intent in this regard were signed. Private sector companies are also being closely involved in these arrangements; for example, an agreement has been concluded with Siemens India.

A solar engineer checks a solar-powered street lamp.Copyright© Abbie Trayler-Smith/DFID, CC BY-NC-ND 2.0 via flickr
Impact on the global climate
Energy consumption in India is increasing inexorably, yet most of the existing power generating plants are obsolete and inefficient. Moreover, they emit excessive amounts of greenhouse gases and other pollutants. Power supply in India – in particular in rural areas – falls well short of demand. This shortage is also severely hampering economic development.
Yet India is already causing the third-highest level of carbon dioxide emissions in the world, exceeded only by China and the USA. The country's economic and environmental policies therefore have a direct impact on the world's climate.
Encouraging the installation of solar plants
Germany is supporting India in making its power supply more technically and economically efficient, and more socially and environmentally sustainable. The focus of development cooperation, therefore, is on promoting renewable energies.
In October 2015, Germany and India agreed to launch the "Indo-German Solar Partnership". Funding for the programme is one billion euros over a five-year period. The main activities to be supported under the partnership are increasing the use of rooftop solar kits, which are not yet widely found in India, and promoting off-grid electrification in rural areas by means of solar installations and solar parks. In addition, the necessary training is to be provided so that local businesses are able to find qualified staff to assist with importing, selling, installing and maintaining solar technology.
Green energy corridors
Over the last few years, India has significantly stepped up the generation of electricity from renewable energy sources. However, feeding in this "renewable" electricity into India's overstretched national grid has now hit a choke point. A sizeable loan provided by the Federal Republic of Germany is helping India to upgrade its network of transmission lines ("green energy corridors"), in order to improve the feed-in of power generated from renewable energy sources (such as solar, wind and hydropower) into the national grid.
Further important goals of development cooperation in this area are to improve energy generating efficiency, reduce power transmission losses, and reduce power consumption by businesses and private households.

Commuters in Mumbai's subway, IndiaCopyright© Rajarshi Mitra, via flickr, CC BY 2.0
Improving the quality of life in burgeoning cities
Approximately one third of India's population lives in urban areas; a quarter of these urban inhabitants are slum-dwellers, living in very poor conditions. Currently, the urban population is growing by 2.3 per cent a year. It is estimated that the number of people living in India's cities will grow by more than 140 million over the next fifteen years. And yet, India's cities are already unable to provide the infrastructure that their inhabitants need.
That is why the Indian government has launched numerous initiatives aimed at urban development - amongst them a "Smart Cities" initiative and a programme to clean up the Ganges River. German development cooperation activities in urban areas are concerned with sanitation and wastewater management, and with the management of household and industrial waste. Germany also provides advisory services for urban planning and governance to officials at national, state and local levels – advising them on matters such as spatial planning, social housing policy and slum modernisation.
Green urban mobility
The largest area of activity by far in the field of sustainable urban development is fostering climate-friendly urban mobility. In November 2019, a declaration of intent to set up a German-Indian partnership for green urban mobility was signed. Under this new partnership, the BMZ will provide India with an amount of one billion euros over a period of five years.
In India the number of cars on the roads is currently growing five times as fast as the population is increasing. The transport sector is one of the biggest emitters of greenhouse gases and air pollution in many of India's cities is already an acute problem and a health hazard. It is intended that the new partnership will contribute towards transforming urban mobility. Thanks to the support provided by Germany, by 2022 public transport systems in India will be able to carry more than six million additional passengers each day. To achieve this goal, the BMZ is supporting the efforts of selected cities and federal states to achieve sustainable town planning and develop intelligent solutions with a view to facilitating electromobility and enabling more people to move around using bicycles and on foot.
Protecting eco-systems and adapting to climate change
It is a matter of national and global importance that India protect the quality of its soil, water and air, and that it conserve biodiversity on the Indian sub-continent. To date, however, the Indian government has made only limited progress towards curbing environmental degradation and mitigating the impacts of climate change.
Germany’s commitment in this priority area focuses on three areas of intervention:
- Water security, and sustainable water and soil management;
- Sustainable management of ecosystems, with a focus on forests; and
- Climate change adaptation and funding for climate action.
Soil and water
The objective with regard to soil and water management is to introduce agricultural practices and strategies that are better suited to conserving soil resources, in particular in major water catchment areas. These are to be coupled with activities to create employment opportunities in rural areas, for example through the processing and refining of agricultural products.
Ecosystems management
The focus in terms of resource conservation is on preserving species-rich ecosystems by making use of intelligent management systems that are adapted to climate change. The emphasis is on forest protection, in particular in the Himalayas and in other forest-rich states. Logging is to be prevented and alternative income opportunities created for the local population.
Climate change adaptation
The goal with regard to climate change adaptation is to prepare the rural population and the relevant government authorities to cope with climate change. Germany and India are working together to develop local strategies for development and climate change adaptation as well as appropriate financing models. For instance, sustainable and resource-conserving practices and the use of modern technologies are intended to help farmers not only increase their yields but also be able to earn a living from farming in the long term, despite changing climatic conditions.
Development facts and figures
General information
ratio | India | Data for Germany |
---|---|---|
Country name new window Definition and sourcea16180138 | Republic of India | Federal Republic of Germany |
Capital new window Definition and sourcea16180110 | New Delhi, part of the "National Capital Territory of Delhi", approximately 16.3 million inhabitants | Berlin, 3.75 million inhabitants |
Surface area new window Definition and sourcea16180096 | 3,287,259.07 sq km (2018) | 357,580 sq km (2018) |
Ranking Human Development Index (HDI) new window Definition and sourcea16180124 | 129 of 189 (2018) | 4 of 189 (2018) |
Development funding
Population data
Poverty
Economy
Communication
Education
Health
Environment
Surface area
Surface area is a country's total area, including areas under inland bodies of water and some coastal waterways.
Ranking Human Development Index (HDI)
The United Nations Development Programme (UNDP) publishes a Human Development Report once a year. The Human Development Index (HDI) contained in the Report records average figures for a country in fundamentally important fields of human development. These include, for example, life expectancy at birth, level of education and per capita income. From a large number of such individual indicators a ranking is calculated. Using this ranking it is possible to establish the average development status of a particular country.
Country name
Population living in rural areas (% of total)
Rural population refers to people living in rural areas as defined by national statistical offices. It is calculated as the difference between total population and urban population.
Population growth rate
Life expectancy
Life expectancy at birth indicates the number of years a newborn infant would live if prevailing patterns of mortality at the time of its birth were to stay the same throughout its life.
Population ages 65 and above (% of total)
Population ages 0-14 (% of total)
Volume of German development cooperation
Funds for development cooperation (Technical and Financial Cooperation) committed by the Federal Republic of Germany under intergovernmental agreements.
Total amount of ODA received
Net official development assistance (ODA) consists of disbursements of loans made on concessional terms (net of repayments of principal) and grants by official agencies of the members of the Development Assistance Committee (DAC), by multilateral institutions, and by non-DAC countries to promote economic development and welfare in countries and territories in the DAC list of ODA recipients. It includes loans with a grant element of at least 25 percent (calculated at a rate of discount of 10 percent). Data are in current U.S. dollars.
Amount of ODA received per capita
Net official development assistance (ODA) per capita consists of disbursements of loans made on concessional terms (net of repayments of principal) and grants by official agencies of the members of the Development Assistance Committee (DAC), by multilateral institutions, and by non-DAC countries to promote economic development and welfare in countries and territories in the DAC list of ODA recipients; and is calculated by dividing net ODA received by the midyear population estimate. It includes loans with a grant element of at least 25 percent (calculated at a rate of discount of 10 percent). Data are in current U.S. dollars.
Undernutrition
Population below minimum level of dietary energy consumption (also referred to as prevalence of undernourishment) shows the percentage of the population whose food intake is insufficient to meet dietary energy requirements continuously. Data showing as 2.5 signifies a prevalence of undernourishment below 2.5%.
Population living below the national poverty line (% of total)
National poverty rate is the percentage of the population living below the national poverty line. National estimates are based on population-weighted subgroup estimates from household surveys.
Population living in absolute poverty (% of total)
The percentage of the population living on less than 1.90 US dollars a day at 2011 international prices. The World Bank last changed the definition of this poverty line in October 2015. Previously, it was defined as the percentage of the population living on less than 1.25 US dollars a day at 2005 international prices. Five countries (Bangladesh, Cambodia, Cape Verde, Jordan and Laos) still use this older definition.
Children who complete primary school (% of total)
Primary completion rate is the percentage of students completing the last year of primary school. It is calculated by taking the total number of students in the last grade of primary school, minus the number of repeaters in that grade, divided by the total number of children of official graduation age.
When using this method of calculation the result may be greater than 100 per cent for some countries. This just means that the number of children completing their primary school education in that particular school year was higher than the number of children who were of official school leaving age.
Proportion of school age children attending primary school
Net enrollment ratio is the ratio of children of official school age based on the International Standard Classification of Education 1997 who are enrolled in school to the population of the corresponding official school age. Primary education provides children with basic reading, writing, and mathematics skills along with an elementary understanding of such subjects as history, geography, natural science, social science, art, and music.
Literacy rate
Adult literacy rate is the percentage of people ages 15 and above who can, with understanding, read and write a short, simple statement on their everyday life.
Public spending on education
Public expenditure on education consists of current and capital public expenditure on education includes government spending on educational institutions (both public and private), education administration as well as subsidies for private entities (students/households and other privates entities).
Number of pupils per teacher at primary school level
Primary school pupil-teacher ratio is the number of pupils enrolled in primary school divided by the number of primary school teachers (regardless of their teaching assignment).
Percentage of the population with sustainable access to safe drinking water
Access to an improved water source refers to the percentage of the population with reasonable access to an adequate amount of water from an improved source, such as a household connection, public standpipe, borehole, protected well or spring, and rainwater collection. Unimproved sources include vendors, tanker trucks, and unprotected wells and springs. Reasonable access is defined as the availability of at least 20 liters a person a day from a source within one kilometer of the dwelling.
Immunization, diphtheria, pertussis, and tetanus (DPT) (% of children ages 12-23 months)
Child immunization measures the percentage of children ages 12-23 months who received vaccinations before 12 months or at any time before the survey. A child is considered adequately immunized against diphtheria, pertussis (or whooping cough), and tetanus (DPT) after receiving three doses of vaccine.
Improved sanitation facilities (% of population with access)
Access to an improved water source refers to the percentage of the population with reasonable access to an adequate amount of water from an improved source, such as a household connection, public standpipe, borehole, protected well or spring, and rainwater collection. Unimproved sources include vendors, tanker trucks, and unprotected wells and springs. Reasonable access is defined as the availability of at least 20 liters a person a day from a source within one kilometer of the dwelling.
People using safely managed sanitation services (% of population)
The percentage of people using improved sanitation facilities that are not shared with other households and where excreta are safely disposed of in situ or transported and treated offsite. Improved sanitation facilities include flush/pour flush to piped sewer systems, septic tanks or pit latrines: ventilated improved pit latrines, compositing toilets or pit latrines with slabs.
Births attended by skilled health staff (% of total)
Births attended by skilled health staff are the percentage of deliveries attended by personnel trained to give the necessary supervision, care, and advice to women during pregnancy, labor, and the postpartum period; to conduct deliveries on their own; and to care for newborns.
Pregnant women receiving prenatal care (%)
Pregnant women receiving prenatal care are the percentage of women attended at least once during pregnancy by skilled health personnel for reasons related to pregnancy.
Under-five mortality rate (per 1,000 live births)
Under-five mortality rate is the probability per 1,000 that a newborn baby will die before reaching age five, if subject to current age-specific mortality rates.
Number of mothers who die during pregnancy or childbirth (per 100,000 live births)
Maternal mortality ratio is the number of women who die during pregnancy and childbirth, per 100,000 live births. The data are estimated with a regression model using information on fertility, birth attendants, and HIV prevalence.
HIV/AIDS prevalence among the 15-49 age group
Prevalence of HIV refers to the percentage of people ages 15-49 who are infected with HIV.
Domestic general government health expenditure (% of GDP)
Public expenditure on health from domestic sources as a share of the economy as measured by GDP.
People using safely managed drinking water services (% of population)
The percentage of people using drinking water from an improved source that is accessible on premises, available when needed and free from faecal and priority chemical contamination. Improved water sources include piped water, boreholes or tubewells, protected dug wells, protected springs, and packaged or delivered water.
Roads, paved (% of total roads)
Paved roads are those surfaced with crushed stone (macadam) and hydrocarbon binder or bituminized agents, with concrete, or with cobblestones, as a percentage of all the country's roads, measured in length.
Individuals using the Internet (% of population)
Internet users are individuals who have used the Internet (from any location) in the last 3 months. The Internet can be used via a computer, mobile phone, personal digital assistant, games machine, digital TV etc.
Passenger cars (per 1,000 people)
Passenger cars refer to road motor vehicles, other than two-wheelers, intended for the carriage of passengers and designed to seat no more than nine people (including the driver).
Mobile cellular subscriptions (per 100 people)
Mobile cellular telephone subscriptions are subscriptions to a public mobile telephone service using cellular technology, which provide access to the public switched telephone network. Post-paid and prepaid subscriptions are included.
Land under cultivation (% of total land area)
Agricultural land refers to the share of land area that is arable, under permanent crops, and under permanent pastures. Arable land includes land defined by the FAO as land under temporary crops (double-cropped areas are counted once), temporary meadows for mowing or for pasture, land under market or kitchen gardens, and land temporarily fallow. Land abandoned as a result of shifting cultivation is excluded. Land under permanent crops is land cultivated with crops that occupy the land for long periods and need not be replanted after each harvest, such as cocoa, coffee, and rubber. This category includes land under flowering shrubs, fruit trees, nut trees, and vines, but excludes land under trees grown for wood or timber. Permanent pasture is land used for five or more years for forage, including natural and cultivated crops.
Land classified as conservation areas (% of total land area)
Terrestrial protected areas are those officially documented by national authorities.
Forested land (% of total land area)
Forest area is land under natural or planted stands of trees of at least 5 meters in situ, whether productive or not, and excludes tree stands in agricultural production systems (for example, in fruit plantations and agroforestry systems) and trees in urban parks and gardens.
Level of carbon emissions per capita (in tons)
Carbon dioxide emissions are those stemming from the burning of fossil fuels and the manufacture of cement. They include carbon dioxide produced during consumption of solid, liquid, and gas fuels and gas flaring.
Power consumption per inhabitant
Electric power consumption measures the production of power plants and combined heat and power plants less transmission, distribution, and transformation losses and own use by heat and power plants.
Jobs in agriculture (% of total)
Employees are people who work for a public or private employer and receive remuneration in wages, salary, commission, tips, piece rates, or pay in kind. Agriculture corresponds to division 1 (ISIC revision 2) or tabulation categories A and B (ISIC revision 3) and includes hunting, forestry, and fishing.
Energy imports (% of total energy consumption)
Net energy imports are estimated as energy use less production, both measured in oil equivalents. A negative value indicates that the country is a net exporter. Energy use refers to use of primary energy before transformation to other end-use fuels, which is equal to indigenous production plus imports and stock changes, minus exports and fuels supplied to ships and aircraft engaged in international transport.
Child labour (% of children aged 7 to 14)
Economically active children refer to children involved in economic activity for at least one hour in the reference week of the survey.
Unemployment rate
Unemployment refers to the share of the labor force that is without work but available for and seeking employment. Definitions of labor force and unemployment differ by country.
Foreign direct investment, net inflows (BoP, current US$)
Foreign direct investment are the net inflows of investment to acquire a lasting management interest (10 percent or more of voting stock) in an enterprise operating in an economy other than that of the investor. It is the sum of equity capital, reinvestment of earnings, other long-term capital, and short-term capital as shown in the balance of payments. This series shows net inflows (new investment inflows less disinvestment) in the reporting economy from foreign investors. Data are in current U.S. Dollars.
Total foreign debt
Total external debt is debt owed to non-residents repayable in foreign currency, goods, or services. Total external debt is the sum of public, publicly guaranteed, and private nonguaranteed long-term debt, use of IMF credit, and short-term debt. Short-term debt includes all debt having an original maturity of one year or less and interest in arrears on long-term debt. Data are in current U.S. dollars.
GNI (current US$)
GNI (formerly GNP) is the sum of value added by all resident producers plus any product taxes (less subsidies) not included in the valuation of output plus net receipts of primary income (compensation of employees and property income) from abroad. Data are in current U.S. dollars. GNI, calculated in national currency, is usually converted to U.S. dollars at official exchange rates for comparisons across economies, although an alternative rate is used when the official exchange rate is judged to diverge by an exceptionally large margin from the rate actually applied in international transactions. To smooth fluctuations in prices and exchange rates, a special Atlas method of conversion is used by the World Bank. This applies a conversion factor that averages the exchange rate for a given year and the two preceding years, adjusted for differences in rates of inflation between the country, and through 2000, the G-5 countries (France, Germany, Japan, the United Kingdom, and the United States). From 2001, these countries include the Euro area, Japan, the United Kingdom, and the United States.
GNI per capita (current US$)
GNI per capita (formerly GNP per capita) is the gross national income, converted to U.S. dollars using the World Bank Atlas method, divided by the midyear population. GNI is the sum of value added by all resident producers plus any product taxes (less subsidies) not included in the valuation of output plus net receipts of primary income (compensation of employees and property income) from abroad. GNI, calculated in national currency, is usually converted to U.S. dollars at official exchange rates for comparisons across economies, although an alternative rate is used when the official exchange rate is judged to diverge by an exceptionally large margin from the rate actually applied in international transactions. To smooth fluctuations in prices and exchange rates, a special Atlas method of conversion is used by the World Bank. This applies a conversion factor that averages the exchange rate for a given year and the two preceding years, adjusted for differences in rates of inflation between the country, and through 2000, the G-5 countries (France, Germany, Japan, the United Kingdom, and the United States). From 2001, these countries include the Euro area, Japan, the United Kingdom, and the United States.
Exports of goods and services (% of GDP)
Exports of goods and services represent the value of all goods and other market services provided to the rest of the world. They include the value of merchandise, freight, insurance, transport, travel, royalties, license fees, and other services, such as communication, construction, financial, information, business, personal, and government services. They exclude compensation of employees and investment income (formerly called factor services) and transfer payments.
Imports of goods and services (% of GDP)
Imports of goods and services represent the value of all goods and other market services received from the rest of the world. They include the value of merchandise, freight, insurance, transport, travel, royalties, license fees, and other services, such as communication, construction, financial, information, business, personal, and government services. They exclude compensation of employees and investment income (formerly called factor services) and transfer payments.
Inflation
Inflation as measured by the consumer price index reflects the annual percentage change in the cost to the average consumer of acquiring a basket of goods and services that may be fixed or changed at specified intervals, such as yearly. The Laspeyres formula is generally used.
Debt service as percentage of exports of goods and services and net income from abroad
Total debt service is the sum of principal repayments and interest actually paid in foreign currency, goods, or services on long-term debt, interest paid on short-term debt, and repayments (repurchases and charges) to the IMF. Exports of goods and services includes income and workers' remittances.
Industry, value added (% of GDP)
Industry corresponds to ISIC divisions 10-45 and includes manufacturing (ISIC divisions 15-37). It comprises value added in mining, manufacturing (also reported as a separate subgroup), construction, electricity, water, and gas. Value added is the net output of a sector after adding up all outputs and subtracting intermediate inputs. It is calculated without making deductions for depreciation of fabricated assets or depletion and degradation of natural resources. The origin of value added is determined by the International Standard Industrial Classification (ISIC), revision 3.
Agriculture, value added (% of GDP)
Agriculture corresponds to ISIC divisions 1-5 and includes forestry, hunting, and fishing, as well as cultivation of crops and livestock production. Value added is the net output of a sector after adding up all outputs and subtracting intermediate inputs. It is calculated without making deductions for depreciation of fabricated assets or depletion and degradation of natural resources. The origin of value added is determined by the International Standard Industrial Classification (ISIC), revision 3.
Services, value added (% of GDP)
Services correspond to ISIC divisions 50-99 and they include value added in wholesale and retail trade (including hotels and restaurants), transport, and government, financial, professional, and personal services such as education, health care, and real estate services. Also included are imputed bank service charges, import duties, and any statistical discrepancies noted by national compilers as well as discrepancies arising from rescaling. Value added is the net output of a sector after adding up all outputs and subtracting intermediate inputs. It is calculated without making deductions for depreciation of fabricated assets or depletion and degradation of natural resources. The industrial origin of value added is determined by the International Standard Industrial Classification (ISIC), revision 3 or 4.
GDP growth (annual %)
Annual percentage growth rate of GDP at market prices based on constant local currency. Aggregates are based on constant 2000 U.S. dollars. GDP is the sum of gross value added by all resident producers in the economy plus any product taxes and minus any subsidies not included in the value of the products. It is calculated without making deductions for depreciation of fabricated assets or for depletion and degradation of natural resources

Passengers at Hazrat Nizamuddin Station in Delhi, IndiaCopyright© Claudio, via flickr, CC BY-NC-ND 2.0
Further information
A selection of links with further development-related background information on India